Objective: In your lab notebook, write a few sentences stating your objective in conducting this laboratory exrercise. Consider the following questions:
We developed the theory for this circuit in Example 3.7.8. In your lab notebook, summarize the main theoretical results/circuit behaviors that you expect to observe today. To guide you, here are a few questions you may wish to address:
What voltage gain and phase behaviors do you expect to observe as \(\omega\rightarrow 0\text{?}\)
At what frequency \(f_0\) do you expect the highest voltage gain? Express your answer as a function of variables \(L\) and \(C\) and show your work. What do you expect voltage gain and phase to be at frequency \(f_0\text{?}\)
In your lab notebook, describe a procedure that you intend to follow to make measurements of voltage gain \(G_V\) and the phase difference between output and input voltages \(\phi=\phi_\text{out}-\phi_\text{in}\text{.}\) Here are a few questions you may wish to consider:
How will you confirm the values associated with your circuit components? Note: You will be unable to verify the inductance \(L\text{,}\) but you should be able to measure values for other components.
In this experiment, you will need to measure \(V_\text{in}\text{,}\)\(V_\text{out}\text{,}\) and \(\phi=\phi_\text{out}-\phi_\text{in}\) for many values of frequency increasing from 200~Hz.
Plan to display your results on a plot with a logarithmic frequency axis and a linear Gain and phase axis using the semilogx command instead of the plot command.
At how many frequencies will you take data? How are you going to determine measurement spacing?
When determining your answers to this question, consider that you likely don’t need a high density of data points in regions where you expect little variation in \(G_V\) and \(\phi\text{,}\) but you will want a higher density of data points in regions where you expect high variation in these quantities.
To determine frequency ranges associated with high and low variation in gain and phase, it can be helpful to perform a quick informal scan of experimental parameters to find the experimental resonant frequency while not actually recording gain and phase measurements. With this information, you can better determine the distribution of frequencies at which to record data.
When comparing to theoretical predictions, use the equations that result from the analysis in Example 3.7.8 to generate theoretical curves for \(G_V\) and \(\phi\) vs frequency, plotting the theoretical curves as a different colored line on the same axes as the experimental data in each case.
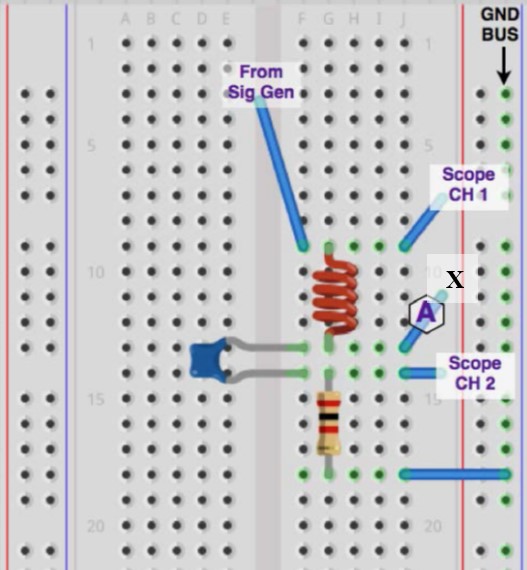
Build your circuit on the prototyping board. When laying out your circuit, it can be useful to build it in a way that is clean and similar to the circuit diagram when possible. See Figure 12.4.2 for an illustration of how one may do this.
Figure12.4.2.Suggested prototyping board layout created using Fritzing. This deliberate placement of CH1 and CH2 connections means that the oscilloscopes phase measurement for CH1-CH2 will correspond to a measurement of \(\phi_\text{out}-\phi_\text{in}\) as we desire.
As you proceed to conduct your experiment, discuss any changes you have to make to your procedure and the reason for those changes. Additionally, if you observe some behavior that you were not expecting or that confuses you, make a note of it in your notebook.
Reminder on oscilloscope operation: Before recording any measurement values into your notebook, you must first
center each signal vertically on the oscilloscope display and adjust the vertical scaling on each channel so that the signals are magnified as much as possible on the screen.
Press the MATH button (in Channel 1 and 2 controls area) and explore the various calculations that can be accomplished using the functions in this menu.
Q: Take a photo displaying the MATH signal as well as your \(V_\text{out}\) signal and place it in your notebook. What is the peak-to-peak amplitude of the MATH signal? What is its phase relative to \(V_\text{out}\text{?}\)
Turn off your circuit. Switch the positions of L and C in your circuit (leaving the Channel 2 probe where it is) and repeat the previous bullet points.
Q: Take a photo displaying the MATH signal as well as your \(V_\text{out}\) signal and place it in your notebook. What is the peak-to-peak amplitude of the MATH signal? What is its phase relative to \(V_\text{out}\text{?}\)
Once you have completed data collection and analysis, write a discussion section that summarizes your results and compares them to your initial theory.
What options can you think of to compare theory to experiment in this lab?
Address any discrepancies that you may have seen along with any issues you may have run into. Speculate regarding solutions/explanations related to these discrepancies/issues. This lab has been designed such that there will be discrepancies between observation and our theory.
Part of this is because there may be a discrepancy between the quoted inductance value \(L\) and the actual inductance of your physical component.
We must also confront the idea that real inductors do not necessarily behave as nicely as the ideal inductors that we discuss in class. The behavior of a real inductor can be better approximated by an inductance \(L_\text{inductor}\) in series with an internal resistance \(R_\text{inductor}\text{,}\) and then that combination in parallel with a parasitic capacitance \(C_\text{inductor}\text{.}\)